When this blog publishes, the final episode of the France section of the 100 Years Later series will have posted across all of my social media channels.
As the story leaves Paris for its infamous rival, London, I wanted to take this opportunity to give a quick update on the numbers across each of my social media platforms. All of the following data was collected on (date) and spans from Episode 40 which posted on February 20th all the way up to Episode 64 which went live on March 16th.
For a full breakdown of the strategy behind this content, I recommend you check out this blog which discusses the marketing strategy behind this series starting all the way back at Episode 1 in Rome, Italy.
Facebook is one of the most popular social media platforms on the planet, mostly through its combination of being the first player on the field to get a proper foothold in the greater culture, its later adoption by older generations, and its impressive campaigning as it spread from the United States to countries on every continent. While the platform surely has its faults, there is a reason it has become such a staple in nearly every social media campaign.
It has also become a staple in my campaign, having experienced tremendous growth compared to the Italy section. When compared to January 26th through February 19th, The French section of episodes saw a 14.9 percent increase in viewership with a total of 3,888 individuals watching at least one episode.
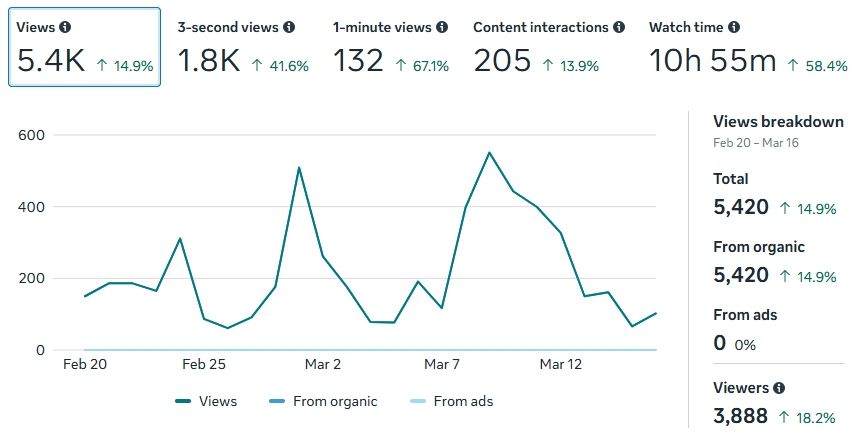
The best performing video during this period was Episode 49: Van Gogh Girl with a total of 975 views. This video is the longest in the series so far as it includes a full-length song I wrote during my travels. As the song plays through, several video effects are used to make some of Van Gogh’s most famous works show up in a way that feels organic to the video. This way, the video had more visual interest than simply a girl playing her guitar and singing. This likely played a role in keeping high viewership.
Instagram is well known for its curated feeds, clean editing, and rose-colored glass view of the world. The editing style of this series is tailored to Instagram, mostly due to my preference for documentary-style editing with just a pinch of the personal touch. However, there has been many recent discussions around a shift in Instagram’s algorithm as people move away from perfectly curated feeds towards more messy, scrapbooked content that feels more real and human. Here, we can see in the numbers that Instagram does in fact seem to be shrugging off its bread-and-butter style of content.
Over the course of the France section, viewership stayed high at a total of 4.1k views from 4,080 different accounts. However, this reach is 40 percent lower than previous. Reach and content interactions have also seen a significant drop, showing that Instagram’s algorithm is in fact moving away from more polished videos.
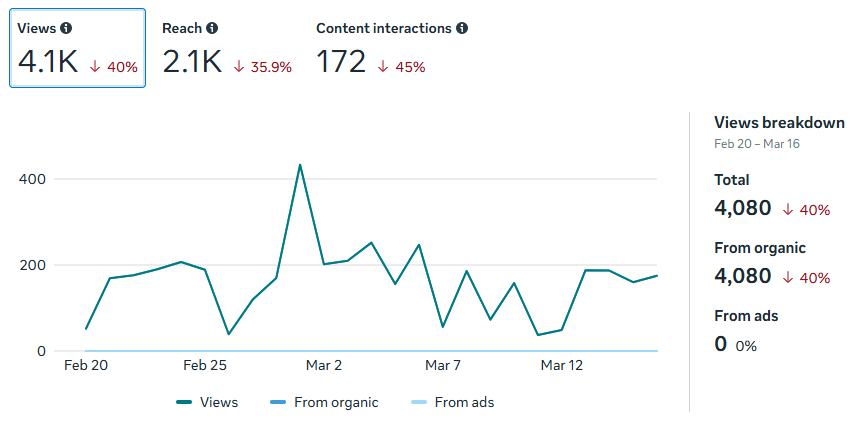
The most viewed episode here was also Episode 49: Van Gogh Girl. In my experience, song-related content tends to perform very well on Instagram, especially when compared to poetry-related content. This suggests that Instagram is an incredibly important social media platform for songwriters and those pursuing musical artistic interests, but more lyrical and word-based art forms may struggle to grow on the platform.
Since LinkedIn is designed for business, it only makes sense that corporate messaging, serious tones, and simplistic graphics would dominate this space. As such, a series that leans into the personal the way that “100 Years Later” does is not expected to perform well on this platform. As mentioned in a previous blog, the main reason that this series is even shared on LinkedIn is personal as my father enjoys watching the content on his preferred branch of social media.
Additionally, the video series acts as a portfolio piece to show my skills in script writing, videography, photography, music composition, video editing, social media strategy, and analytical reporting – all of which are great skills to present on a career-minded platform.
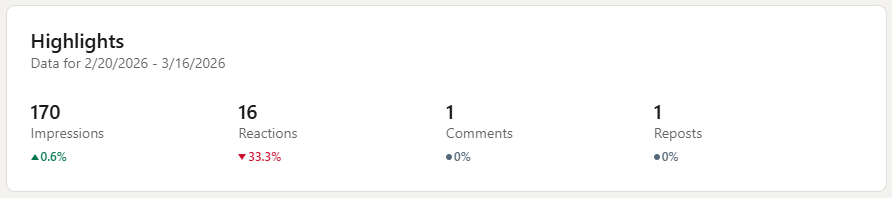
Here, we see that reactions have taken a dip while impressions has seen a slight increase. As expected, comments and reposts remain low as is typical for this kind of content on this platform.
TikTok
TikTok has been a surprisingly impactful part of my social media strategy. Previously, I had stayed away from the platform due to the concerns around ownership and accessibility in the United States. However, it is clear to see now that the 100 Years Later series continues to do incredible numbers on the platform.
Video views have raised 74.3 percent to over 19,000 total, with profile views and likes experiencing a 65.6 and 50.8 percent increase respectively. While shares have experienced a negligible decrease, the increase in comments suggests that this content is starting to build community.
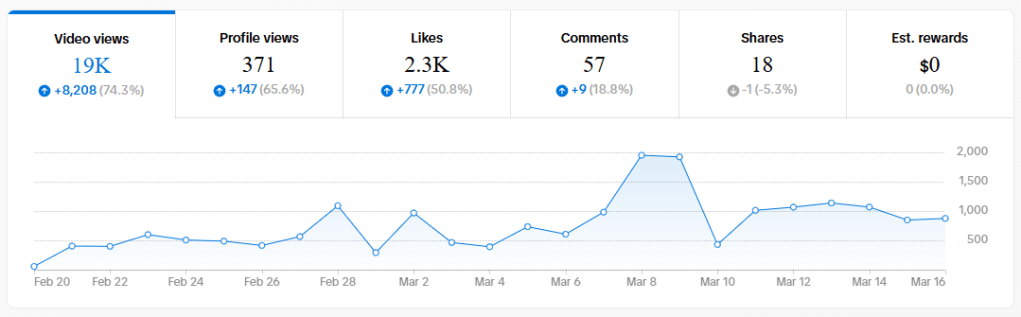
When it comes to traffic source, 96 percent of people found the 100 Years Later series through their For You page, while 2.5 percent visited my personal profile and 1.4 percent found my content through search. Search queries that prompted finding my content included the following:
- Monet paintings
- Lilypad museum paris
- Ornate ceiling
- Louvre heist
The best performing videos during this time were Episode 59: L’Orangerie, Episode 61: the Louvre, and Episode 60: Musee Rodin. All three of these videos have over 1,000 views each and also netted the most likes. However, when it comes to gaining followers, only Episodes 61 and 60 make the top three, with the third spot going to Episode 64: To the Fire Outside My Door.
When this information is taken into consideration, it is clear to see that travel-related content that targets specific search terms performs well in the algorithm. As for artistic content, posts that are more personable can be a fantastic tool for building an audience.
Lastly, while there is not enough evidence to state this as fact, there is a suggestion that TikTok’s algorithm is slowly putting more weight onto searched items. Videos that aligned with searched terms also performed better than those that did not align with search terms. However, this is purely correlative since there is not enough data to prove causation.
YouTube
Like TikTok, YouTube has seen tremendous growth as the 100 Years Later series continues to drive traffic. Viewership during this period fell just shy of 6,000 total views, coming to 19.7 hours of total watch time. There was also a gain of 18 subscribers in the 25-day period.
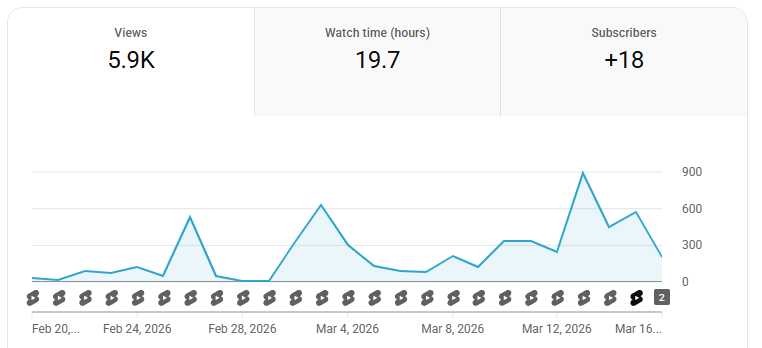
Additionally, there has been a total of 1,800 engaged views and 191 likes, both of which are a significant increase from the previous month. This data suggests that the process of audience-building, while slow, is seeing steady improvement.
The top three best-performing videos during this time were Episode 61: the Louvre, Episode 49: Van Gogh Girl, and Episode 46: the Van Gogh Museum.
For Episode 61: the Louvre, the average view duration (AVD) was 0:32 with a total of 770 views. Episode 49: Van Gogh Girl had a higher AVD at 1:17, but only has 584 views. The third best performer, Episode 46: Van Gogh Museum has a similar AVD to Episode 61 at 0:35 and a similar view count to Episode 49 at 560 total views. While this audience is small compared to other channels, this is showing tremendous growth compared to previous social media marketing strategies.
Overall, the goals of the 100 Years Later series seem to be on target. Community continues to be built, especially on TikTok and YouTube. While viewership has seen a dip on Instagram, it has drastically increased on all other social media platforms. In general, following has expanded across channels at an accelerated rate especially when compared to other accounts of similar size.
It has yet to be seen how this increase in viewership, following, and community means for book sales. As we approach the publish date for the “Sincerely” anthology, it will be interesting to see whether these efforts result in increased sales.

Leave a comment